Abstract
Single-cell RNA sequencing (scRNA-seq) has become an essential technique for studying cellular heterogeneity and complex biological systems. During this winter research training, I systematically studied the general workflow and analytical principles of scRNA-seq based on Single Cell Best Practices and related resources, covering key steps such as data preprocessing, quality control, normalization, dimensionality reduction, clustering, and cell type annotation. To consolidate the knowledge, I first reproduced a complete analysis pipeline using publicly available immune cell data to familiarize myself with standard procedures and tools, then independently applied the same workflow to a publicly available human brain infection-related single-cell dataset, identifying distinct cell populations and infection-associated transcriptional changes across cell types. Overall, this training deepened my understanding of scRNA-seq data analysis, demonstrated the adaptability of standardized workflows to diverse biological contexts, and provided preliminary insights into cellular responses in infected human brain tissue as a foundation for further studies.
Introduction
Single-cell RNA sequencing (scRNA-seq) has emerged as a powerful technology for profiling gene expression at the resolution of individual cells, enabling the systematic exploration of cellular heterogeneity within complex tissues. Compared with bulk RNA sequencing, scRNA-seq allows the identification of rare cell populations, the characterization of cell states, and the investigation of cell-type–specific responses under different physiological and pathological conditions. As a result, it has been widely applied in studies of immunology, neuroscience, and infectious diseases.
Despite its broad applicability, scRNA-seq data analysis remains challenging due to high technical noise, batch effects, and the complexity of downstream analytical steps. A standardized and well-documented analytical workflow is therefore essential for beginners to correctly process and interpret single-cell data. In recent years, community-driven guidelines such as Single Cell Best Practices have provided comprehensive recommendations covering key steps of scRNA-seq analysis, including quality control, normalization, dimensionality reduction, clustering, and cell type annotation.
In this winter research training, I first studied the general principles and analytical workflow of scRNA-seq by following the Single Cell Best Practices guidelines and other related learning resources. To gain hands-on experience, I reproduced a complete analysis pipeline using publicly available immune cell single-cell datasets. Building on this foundation, I independently collected a human brain infection–related scRNA-seq dataset and applied the same standardized workflow to this dataset. Through comparative analysis, I evaluated the applicability of the workflow to a different biological context and explored cell-type–specific transcriptional changes associated with infection.
This training aimed to strengthen my understanding of scRNA-seq data analysis and to develop practical skills in applying standardized pipelines to real-world datasets, providing a foundation for future research in single-cell transcriptomics.
Materials and Methods
Learning Resources and Workflow Design
To design an appropriate analysis workflow, the overall strategy was developed based on the guidelines provided by Single Cell Best Practices 1, with particular emphasis on rigorous data quality assessment, batch effect evaluation, and flexible downstream analysis.
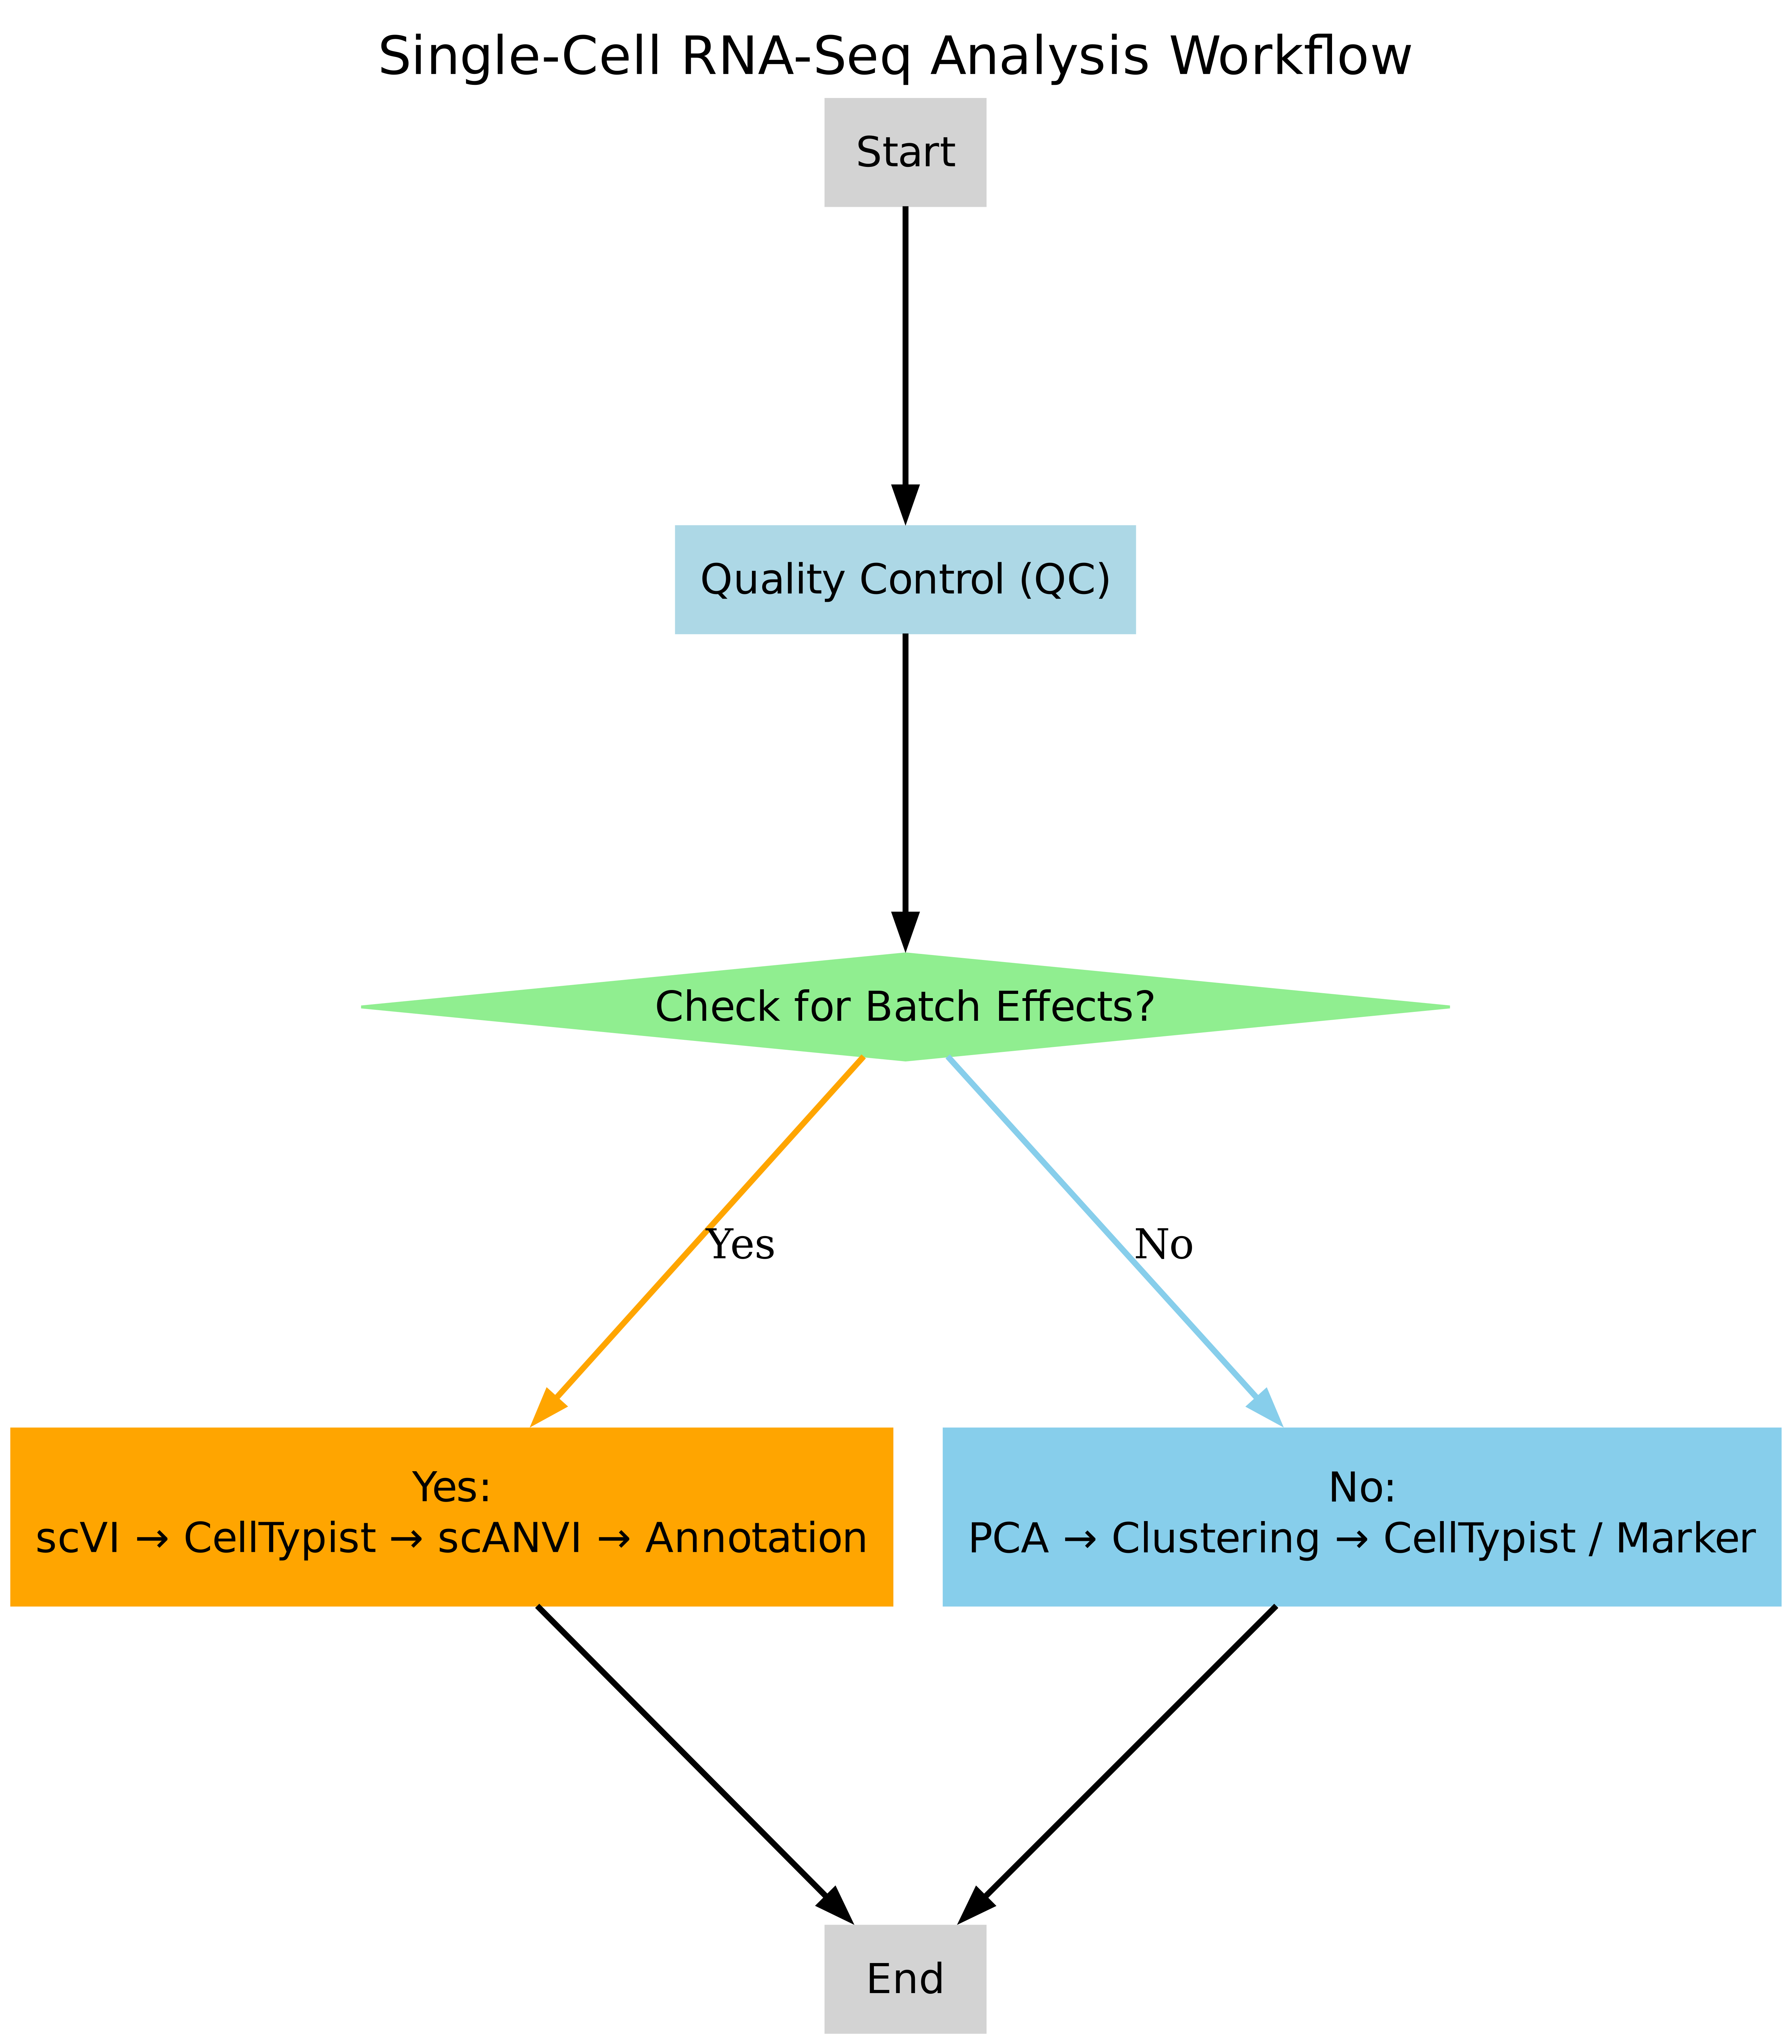
At the beginning of the analysis, potential batch effects were systematically assessed using exploratory data visualization and metadata inspection. This initial evaluation determined whether samples originated from multiple batches or experimental conditions that could introduce technical variation. Based on this assessment, one of two alternative analysis workflows was selected.
When clear batch effects were detected, a latent variable-based integration strategy was adopted using scvi-tools. Specifically, scVI was first applied to learn a batch-corrected latent representation directly from raw count data. To enable reliable cell type annotation, a subset of high-confidence cells was annotated using CellTypist on a log-normalized and highly variable gene-filtered copy of the data. These high-confidence labels were then used to initialize scANVI, which performed semi-supervised learning to propagate cell type annotations across the full dataset while preserving batch correction.
In contrast, when no obvious batch effects were observed, a standard analysis pipeline was employed. This workflow included quality control, normalization, highly variable gene selection, principal component analysis (PCA), neighborhood graph construction, and clustering using the Leiden algorithm. Cell type annotation was subsequently performed using either automated prediction with CellTypist or manual validation against canonical marker genes, depending on data complexity and annotation confidence.
The overall workflow design, including both branches (with and without batch effects), is illustrated in Figure1. This adaptive workflow design enabled the selection of the most appropriate analytical strategy according to dataset characteristics, ensuring robust batch integration, reliable cell type annotation, and analytical consistency across different single-cell datasets processed during the study.
Immune Cell Dataset
The immune cell dataset used in this training was derived from a publicly available 10x Genomics Multiome dataset generated for a single-cell data integration challenge at the NeurIPS 2021 conference2. The dataset consists of single-cell multiomic profiles from human bone marrow mononuclear cells collected from 12 healthy donors and measured at four different experimental sites, thereby introducing nested batch effects at the full dataset level.
In this study, only a single subset of the dataset—sample 4 from donor 8—was used for downstream analysis. As this subset originates from a single donor and a single experimental site, no explicit batch effects were expected within the selected data. This subset was therefore suitable for demonstrating standard scRNA-seq preprocessing and downstream analysis following best practices.
Despite the absence of apparent batch effects, two analytical strategies were applied to this dataset. First, a conventional scRNA-seq workflow based on principal component analysis (PCA) was performed to establish a baseline analysis and cell type annotation. In parallel, a latent variable–based workflow using scVI and scANVI was also applied. This additional analysis was conducted for methodological exploration and to ensure familiarity with batch-aware and semi-supervised modeling approaches, even in scenarios where batch correction is not strictly required.
By applying both workflows to the same immune cell dataset, this analysis provided a direct comparison of standard and deep learning–based approaches and served as a controlled benchmark for evaluating the behavior of scVI and scANVI under minimal batch effect conditions.
Human Brain Infection Dataset
To further evaluate the applicability of the analysis workflow to a more complex biological context, a human brain infection–related single-cell RNA sequencing dataset was independently selected from a publicly available resource (GSE309815)3. This dataset was generated using undirected human cerebral organoids derived from induced pluripotent stem cells (hiPSCs) and was designed to model neural development and host responses to viral infection in vitro.
The organoids were cultured in spinning bioreactors and divided into three experimental groups, including two infection conditions (MV1-infected and MV2-infected) and an uninfected control group (NBH). Each group was sampled at two 120 and 180 days post-infection, resulting in multiple experimental conditions across infection subtype. Single-cell RNA-seq libraries were prepared using the 10x Genomics Chromium Next GEM Single Cell 3’ platform and sequenced on an Illumina NovaSeq 6000 system.
Due to the presence of multiple infection conditions, this dataset was expected to exhibit both biological variability and potential batch effects. Therefore, it provided an appropriate test case for applying batch-aware integration and semi-supervised annotation strategies. The same workflow design principles established during the immune cell analysis were applied to this dataset, including initial quality control, batch effect assessment, and the selection of either a standard PCA-based pipeline or a latent variable–based approach using scVI and scANVI.
This dataset enabled the exploration of infection-associated transcriptional changes in neural cell populations and served as a realistic and biologically meaningful example for testing the robustness and flexibility of the single-cell analysis workflow.
Data Preprocessing and Quality Control
Quality control (QC) was performed to remove low-quality cells, technical artifacts, and ambient RNA contamination prior to downstream analysis. All QC procedures were conducted using Scanpy and related Python-based single-cell analysis tools.
Cell-level Quality Control
Mitochondrial genes were identified based on gene names starting with the prefix “MT-”. Ribosomal genes RPS, RPL and hemoglobin genes HB were also annotated for diagnostic purposes. Standard per-cell QC metrics were computed, including total UMI counts, number of detected genes, and the percentage of mitochondrial gene expression. In addition, the fraction of counts contributed by the top 20 most highly expressed genes was calculated to assess transcript dominance.
QC metrics were saved prior to filtering, and their distributions were visualized using violin plots and scatter plots to facilitate inspection of data quality and threshold selection.
Low-quality cells were identified using a robust, data-driven outlier detection strategy based on the median absolute deviation (MAD). Cells were flagged as outliers if they deviated beyond five MADs from the median in any of the following log-transformed metrics: total counts, number of detected genes, or the percentage of counts in the top 20 expressed genes. This approach allows automatic identification of extreme values while remaining robust to skewed distributions.
Mitochondrial outliers were identified separately. Cells were removed if their mitochondrial gene expression exceeded either three MADs above the median or an absolute threshold of 8%, ensuring the exclusion of stressed or dying cells. Cells flagged as either general outliers or mitochondrial outliers were removed from further analysis.
Post-filtering, QC scatter plots were regenerated to confirm the effectiveness of the filtering procedure.
After cell-level filtering, raw count data were preserved in a dedicated data layer to maintain access to untransformed counts for downstream modeling and correction steps.
Ambient RNA Correction and Gene Filtering
To account for ambient RNA contamination, SoupX was applied using raw and filtered count matrices derived from the original 10x Genomics output. A clustering-based approach was used to estimate contamination levels: cells were first normalized, log-transformed, and embedded using principal component analysis, followed by neighborhood graph construction and Leiden clustering.
Cluster assignments were supplied to SoupX to improve contamination estimation. Ambient RNA fractions were then automatically inferred, and corrected expression counts were generated. The corrected count matrix replaced the default expression matrix and was additionally stored as a separate data layer for reference.
Following ambient RNA correction, genes expressed in fewer than 20 cells were removed to eliminate low-information features. This final gene filtering step ensured that downstream analyses focused on biologically meaningful and reliably detected genes.
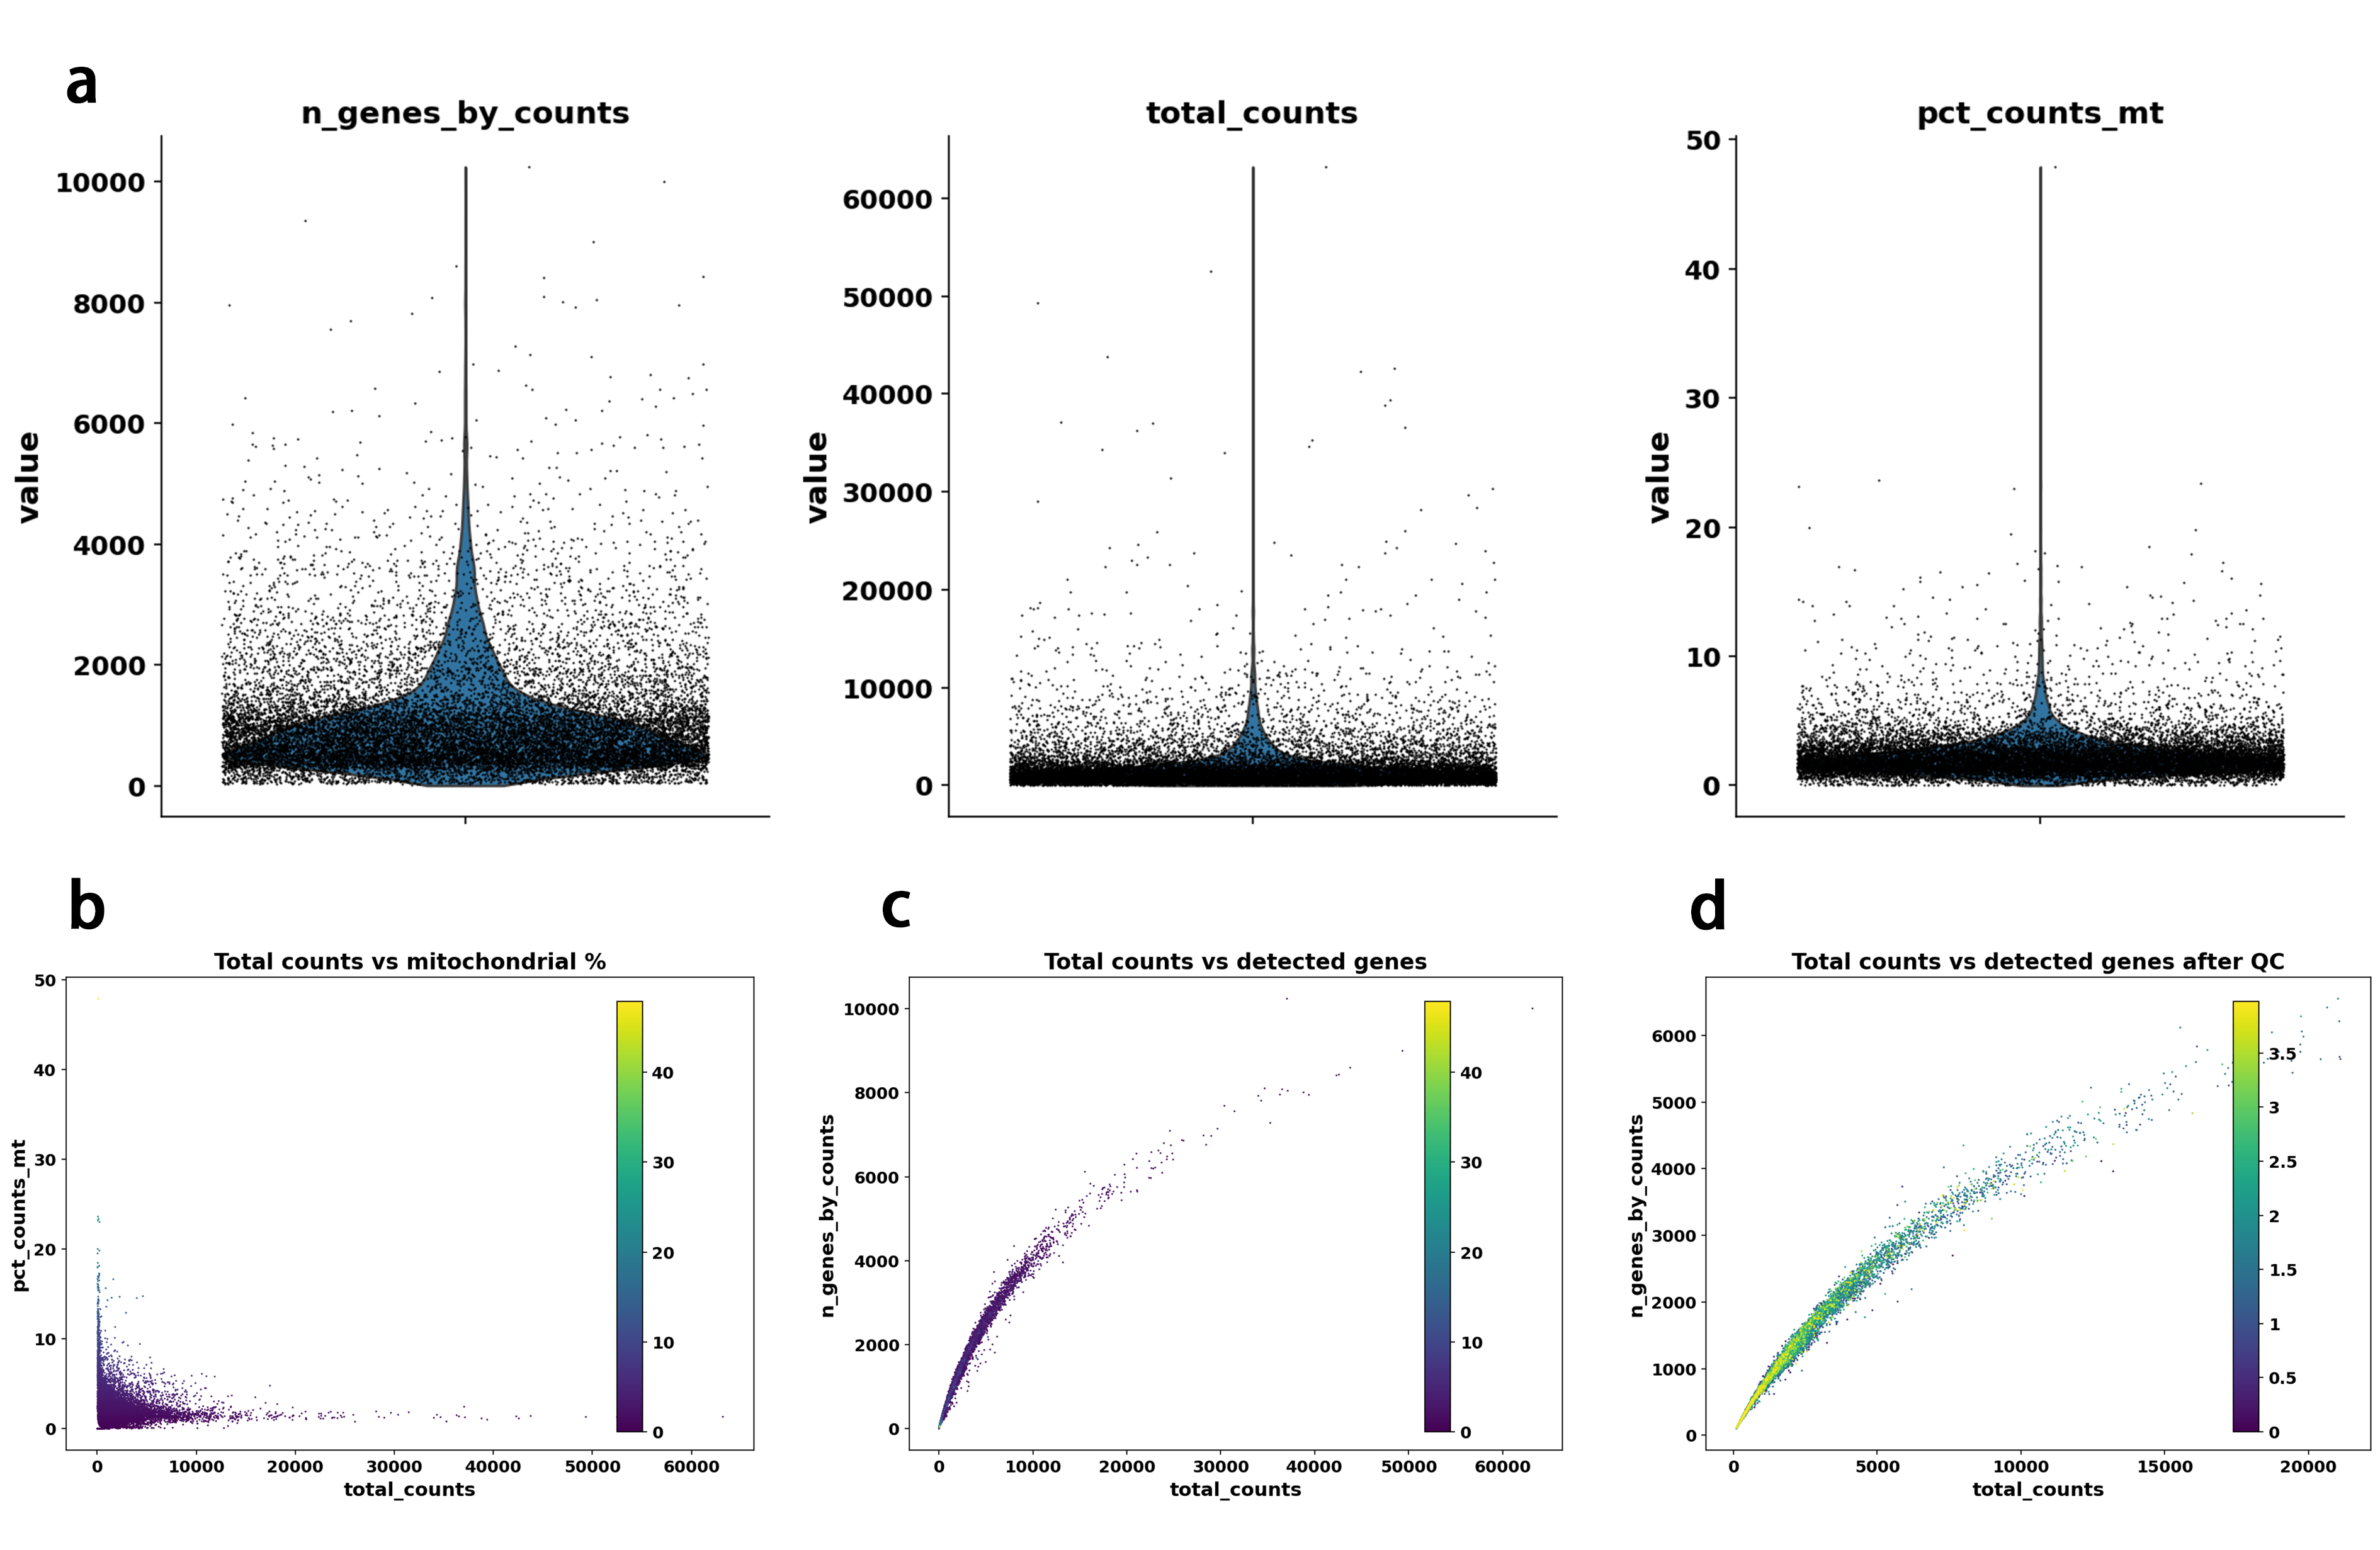
Overall, this multi-step QC and preprocessing strategy combined robust outlier detection, visualization-guided assessment, and ambient RNA correction to produce a high-quality single-cell dataset suitable for downstream integration, annotation, and modeling. The overall QC effect was highly satisfactory, as shown in Figure2.
Quality control assessment revealed a high-quality single-cell RNA-seq dataset. The pre-filtering distributions of detected genes, total UMI counts, and mitochondrial gene percentages were well-concentrated with sharp, symmetric peaks and minimal low-quality tails Figure2a, indicating low levels of ambient RNA contamination, dying cells, or empty droplets from the outset. Scatter plots further confirmed a clean linear relationship between total counts and detected genes before filtering Figure2c, with almost no aberrant clusters of high mitochondrial content at low counts Figure2b. After applying standard QC thresholds, the post-filtering distribution became notably tighter and more uniform Figure2d, effectively removing the few remaining low-quality cells while preserving the vast majority of informative data. Overall, the QC results are highly satisfactory and demonstrate that the raw data were already of excellent quality, requiring only moderate filtering and setting a strong foundation for reliable downstream analyses such as integration, clustering, and cell type annotation.
Downstream Analysis
Following quality control and preprocessing, downstream analyses were conducted within a unified computational framework. The choice of representation learning strategy was conditioned on the presence or absence of batch effects, as assessed using a combination of exploratory visualization and quantitative batch-mixing metrics. This design enabled flexible handling of technical variation while maintaining consistent biological interpretation across datasets.
Representation Learning Strategy Selection
Datasets were first evaluated for batch effects to guide the selection of appropriate representation learning approaches.
For datasets exhibiting minimal batch effects, raw expression counts were normalized by scaling total counts per cell to a fixed value, followed by log_1p transformation. Highly variable genes (HVGs) were identified using the Seurat v3 flavor method to prioritize biologically informative features and reduce technical noise. Principal component analysis (PCA) was then applied to the scaled, HVG-filtered expression matrix to derive a low-dimensional embedding suitable for downstream analyses.
For datasets with detectable batch effects or complex experimental designs, single-cell variational inference (scVI) was applied directly to raw count data without prior normalization, log-transformation, or highly variable gene selection. This generative modeling framework internally accounts for sequencing depth, library size, and batch-associated technical variability through its negative binomial likelihood and latent variable architecture, yielding a batch-corrected and biologically meaningful low-dimensional representation.
To support cell type annotation, a separate log-normalized data copy was prepared exclusively for automated prediction, providing high-confidence labels for subsequent semi-supervised refinement.
Clustering and Visualization
Low-dimensional representations obtained from either PCA or the scVI latent space were used to construct a k-nearest neighbor (kNN) graph capturing cell–cell similarities. Community detection was performed using the Leiden algorithm to identify transcriptionally distinct populations. Uniform Manifold Approximation and Projection (UMAP) was applied to the same embeddings for two-dimensional visualization of cellular structure, cell type distributions, and batch mixing patterns.
Cell Type Annotation and Semi-Supervised Learning
Cell type annotation integrated automated prediction, canonical marker gene validation, and semi-supervised learning.
For scVI-processed datasets, high-confidence labels derived from automated predictions were used to construct a supervised subset, while low-confidence cells were labeled as unknown. This subset was used to initialize a semi-supervised scANVI model trained on top of the scVI latent representation. scANVI propagated labels to unlabeled cells while preserving batch correction, producing refined cell type assignments across the entire dataset. Posterior probabilities were obtained for all predictions, and cells with low confidence were flagged as ambiguous to avoid over-assignment.
For PCA-processed datasets with minimal batch effects, cell type annotation relied directly on automated predictions combined with manual validation against established marker genes. Annotation consistency was assessed by examining cluster-specific marker gene expression patterns.
Evaluation and Visualization of Results
UMAP projections were used to visualize clustering outcomes, final cell type annotations, prediction confidence scores, and batch integration quality. Annotation robustness was evaluated by comparing initial automated labels with final semi-supervised assignments and by confirming biological coherence through marker gene expression and cross-dataset consistency checks.
Result
Workflow Validation Using Immune Cell Data
To validate the correctness and robustness of the proposed downstream analysis workflow, we first applied it to a well-characterized immune cell dataset and evaluated the results based on clustering structure and cell type annotation outcomes. Immune cell datasets serve as a standard benchmark due to their well-defined transcriptional heterogeneity and established cell type markers.
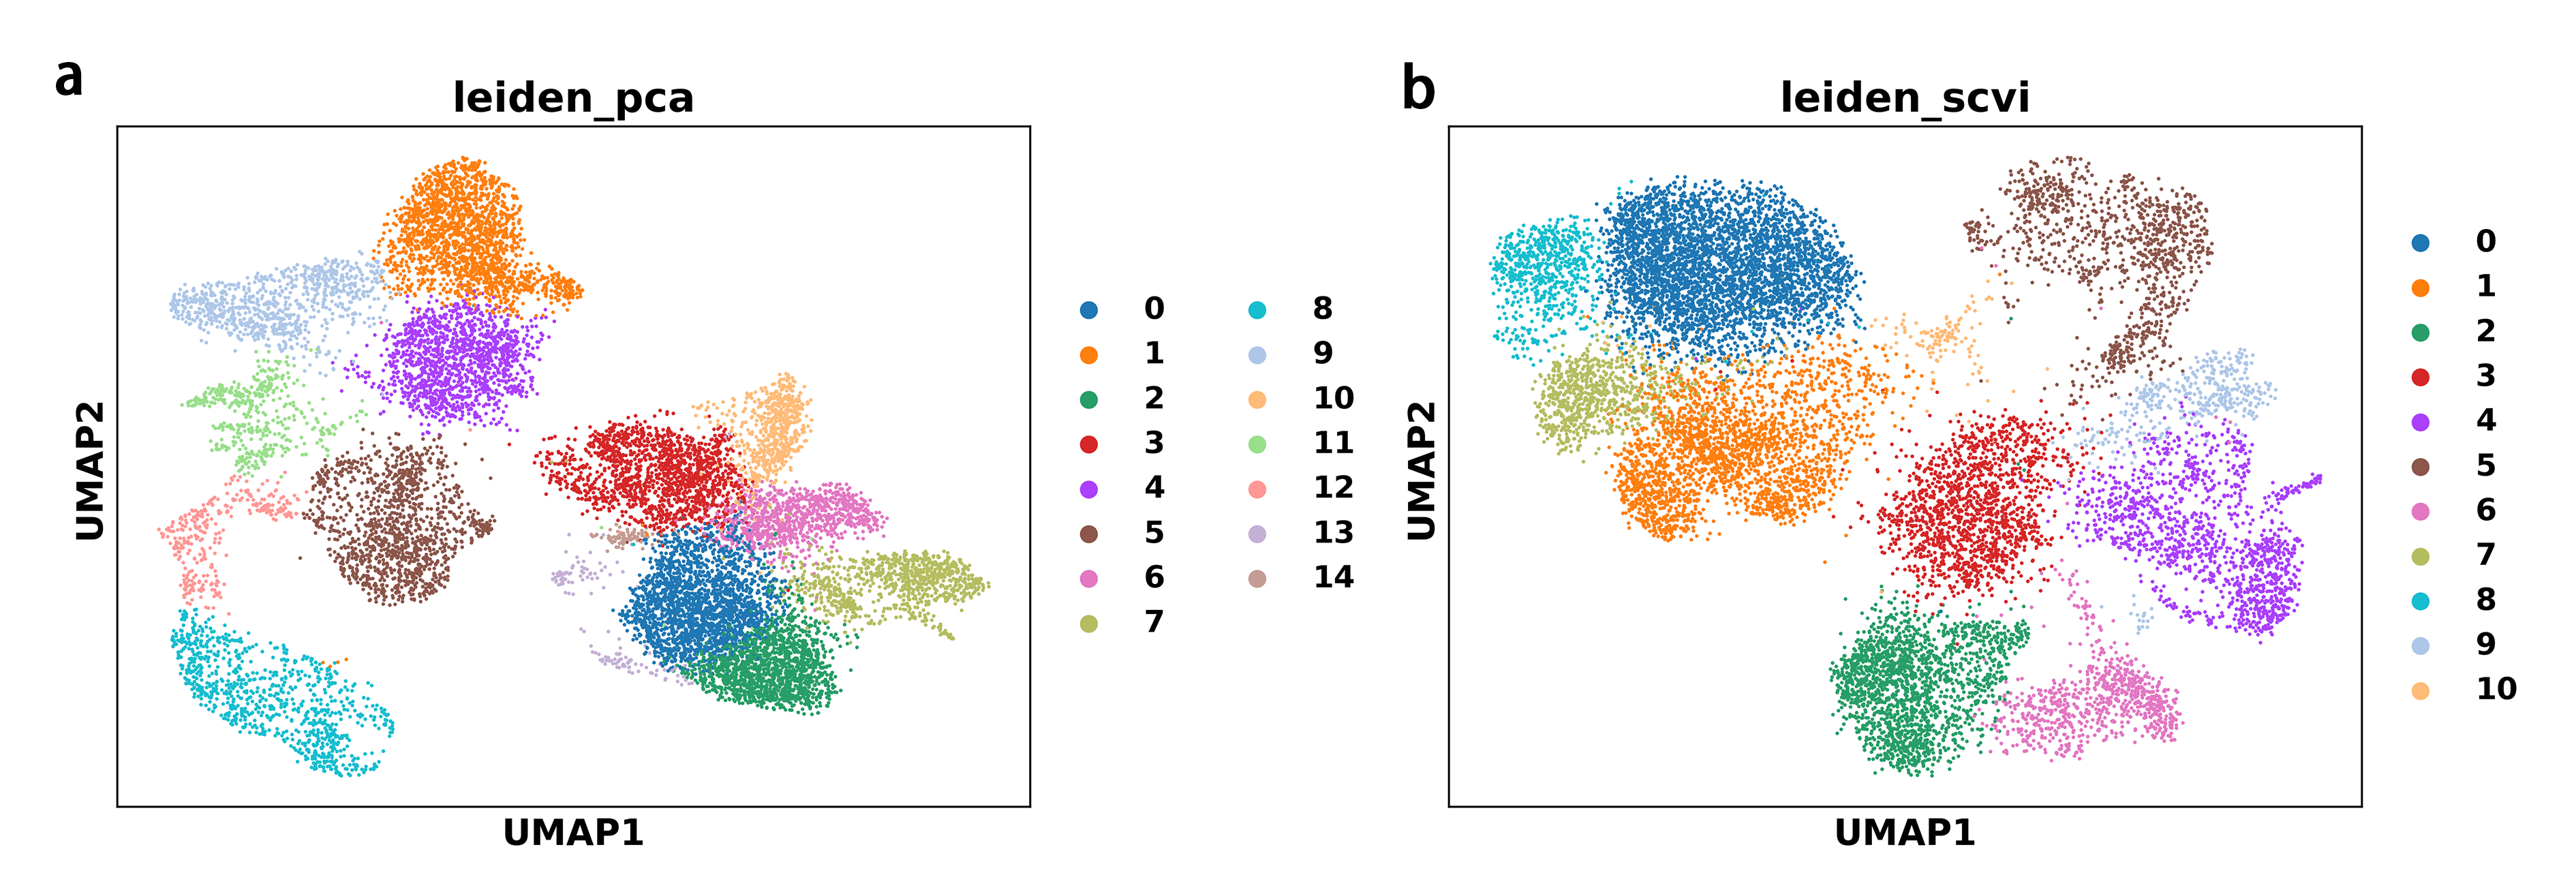
Low-dimensional representations learned through PCA (linear dimensionality reduction) and scVI (non-linear generative modeling) produced clear and biologically meaningful cellular clusters in the UMAP embeddings, shown in Figure3. The Leiden clustering results showed moderate similarity between the two approaches, with an estimated Adjusted Rand Index (ARI) of approximately 0.60. While PCA-based clustering yielded a larger number of clusters (15 vs. 11 for scVI) and finer subcluster separation, scVI-based clustering produced more compact clusters with sharper boundaries. These differences primarily arise from the distinct methodological properties of the two representation learning strategies—PCA captures maximal variance in a linear manner, whereas scVI models raw counts through a probabilistic framework that accounts for technical variability and non-linear relationships. Despite these variations in cluster number and boundary definition, the overall topological structure and major cell population distributions remained largely consistent, supporting the robustness of the workflow across different representation learning approaches.
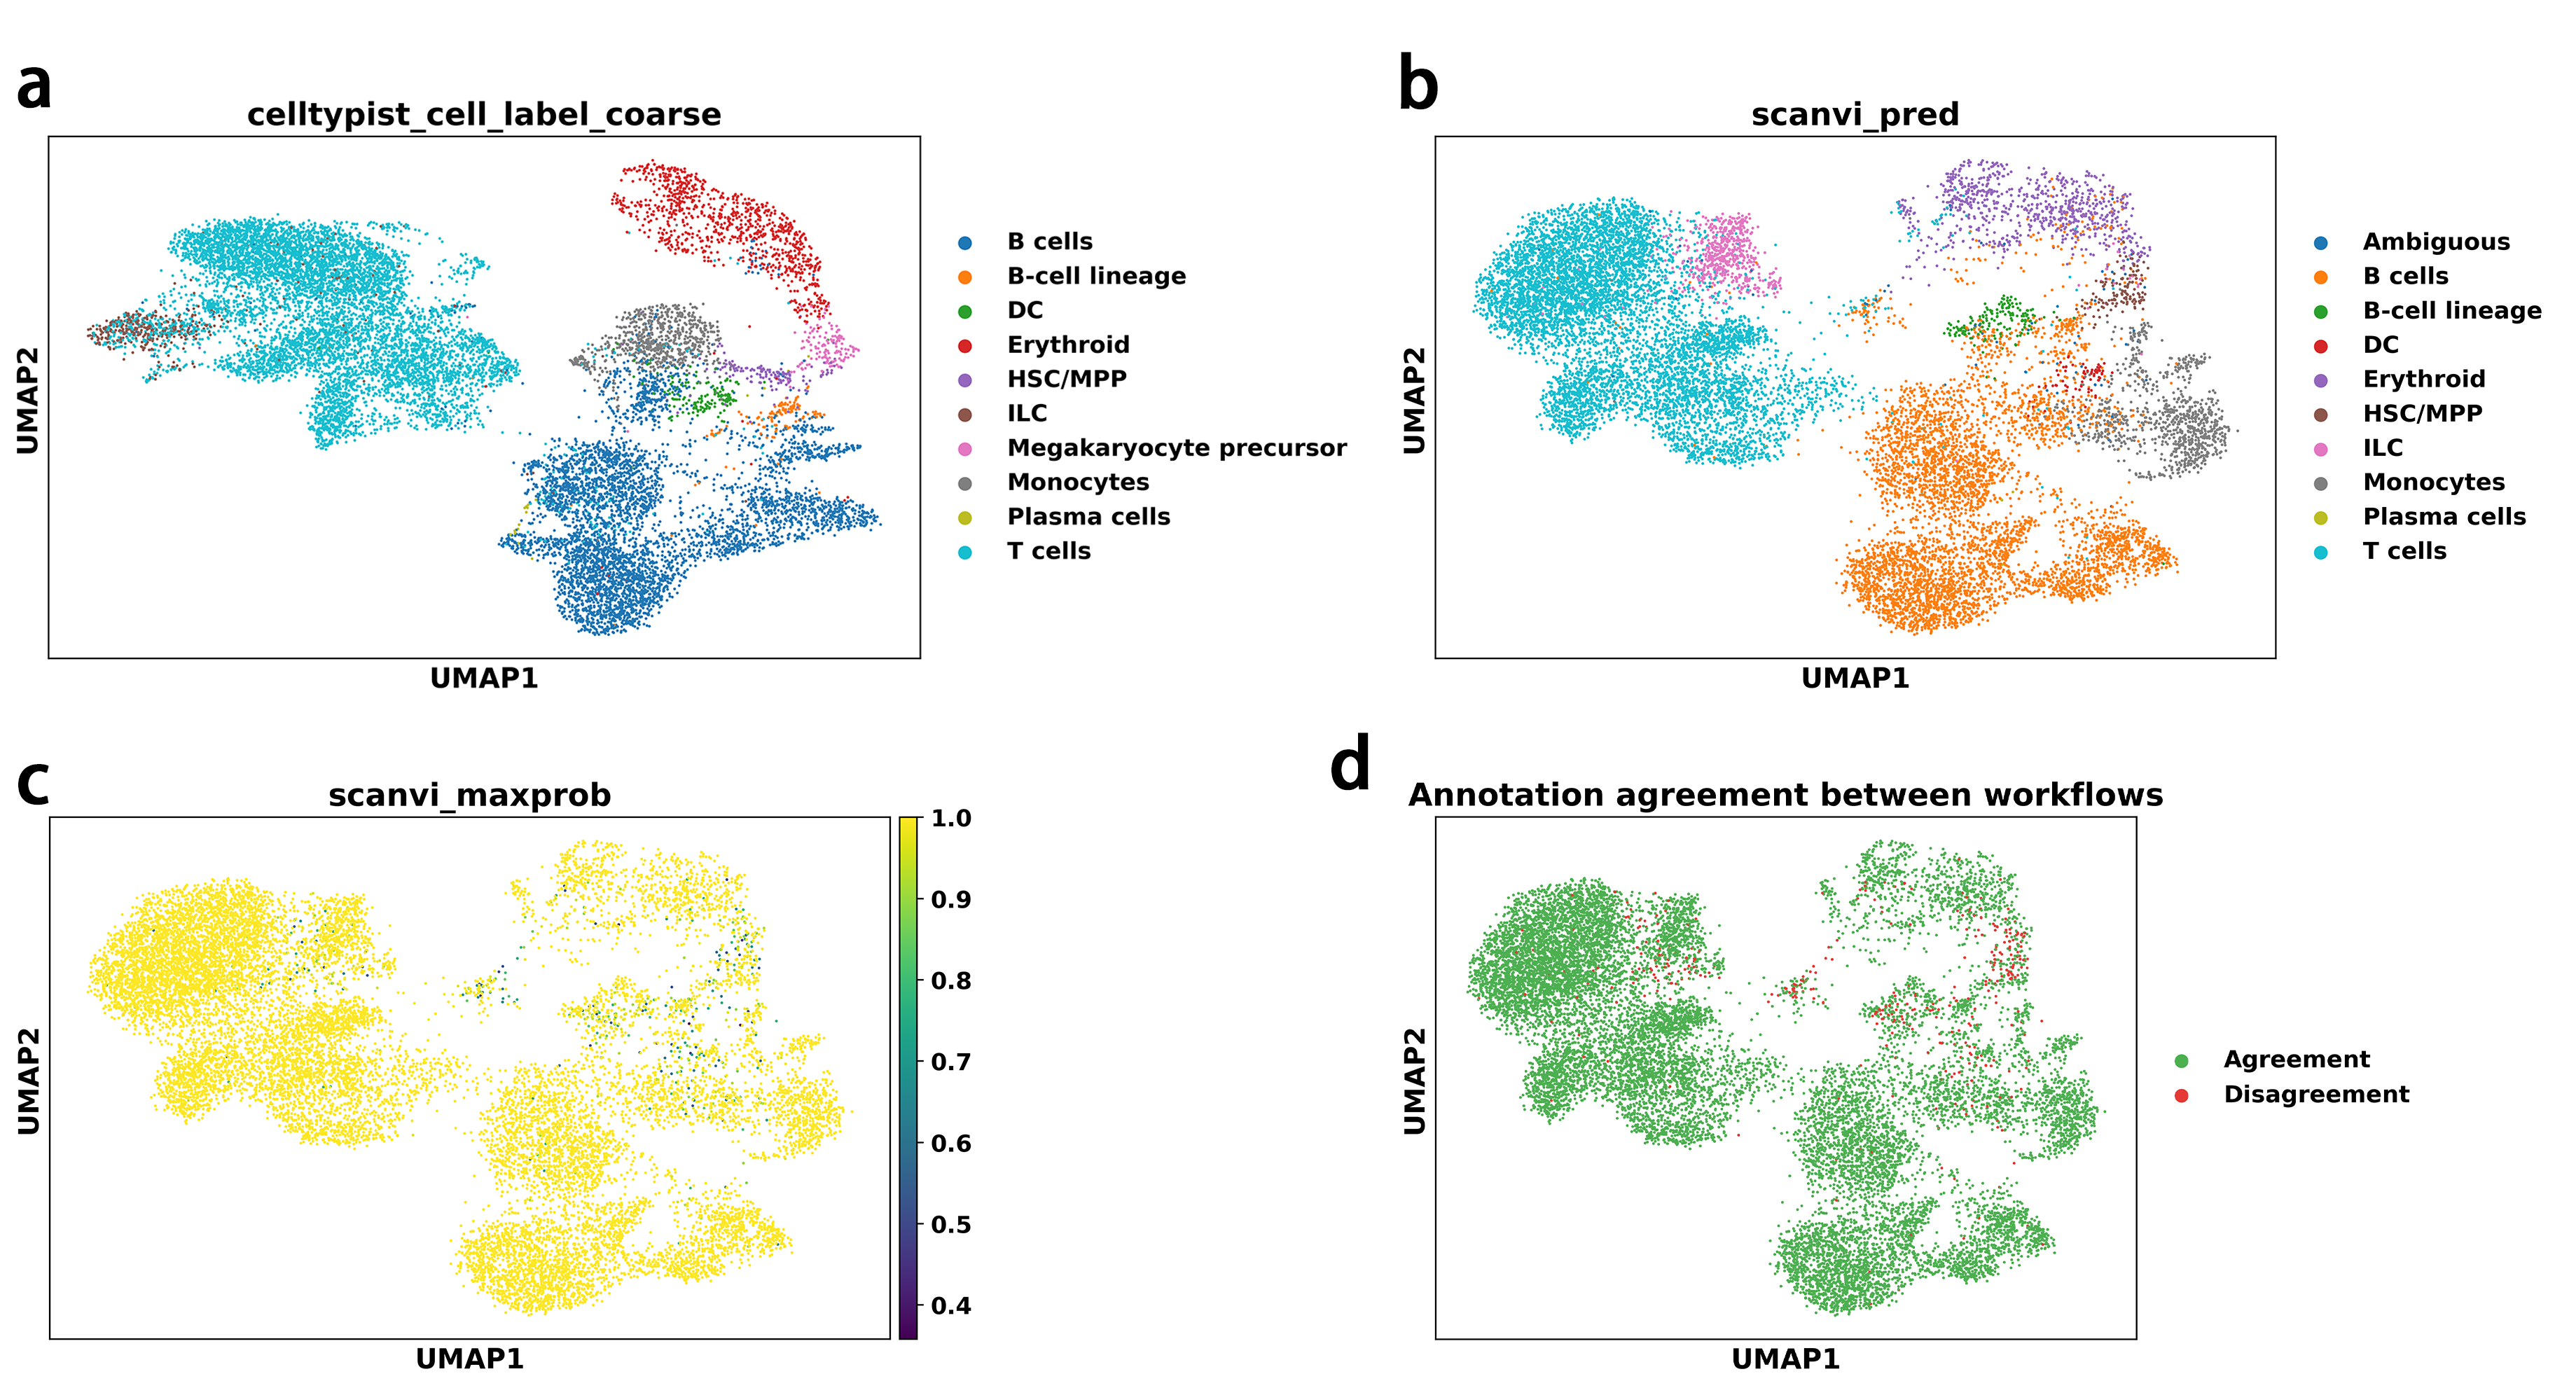
To further validate the robustness of the workflow at the level of cell type annotation, we compared annotation outcomes obtained from two complete analysis pipelines: a standard PCA-based workflow followed by automated CellTypist prediction, and a batch-aware semi-supervised workflow based on scVI and scANVI. This comparison was performed on a single-batch immune cell dataset to assess whether both workflows could produce coherent and biologically meaningful annotations under minimal technical confounding, as summarized in Figure4.
The standard PCA-based workflow produced a complete set of immune cell type labels with clear spatial separation in the UMAP embedding, as shown in Figure4a. These annotations were consistent with known immune cell transcriptional structure and established marker gene patterns. In parallel, the scVI–scANVI workflow yielded a comparable global annotation landscape in the scVI latent space, shown in Figure4b, while additionally providing posterior probability estimates that explicitly quantified prediction uncertainty, illustrated in Figure4c. Cells with lower prediction confidence were primarily localized at cluster boundaries or transitional regions, indicating appropriate uncertainty modeling rather than overconfident label assignment.
Despite differences in representation learning strategies and neighborhood graph construction, the two workflows exhibited a high degree of concordance in major immune cell type assignments. This agreement is visualized in Figure4d, where concordant and discordant annotations between workflows are highlighted. Discrepancies were restricted to a limited subset of cells and did not alter the overall biological interpretation. Together, these results demonstrate that both the standard and batch-aware workflows reliably recover consistent and biologically coherent cell type annotations in a benchmark immune cell dataset, supporting the correctness and flexibility of the proposed analysis framework.
Cell Type Identification in Human Brain Dataset
To establish a robust cellular framework for downstream analysis of infection-associated transcriptional changes, we performed unsupervised clustering and marker-based annotation on the integrated dataset comprising MV1, MV2, and NBH conditions. Using the scVI latent representation, we constructed a neighborhood graph and applied Leiden clustering (resolution = 0.8), followed by UMAP visualization. Major cell populations were identified based on established marker genes for human cerebral organoids and fetal brain development, including SOX2, NES, PAX6, and VIM for radial glia/neural progenitors; EOMES for intermediate progenitors; TBR1, SATB2, BCL11B, and CUX2 for excitatory neurons; GAD1 and GAD2 for inhibitory neurons; GFAP, AQP4, and SLC1A3 for astrocyte-like cells; PDGFRA, VCAN, and OLIG2 for oligodendrocyte precursor cells (OPCs); and MKI67 and TOP2A for proliferating cells.
This annotation yielded seven major cell types with clear spatial separation in UMAP embeddings, as shown in Figure5. Quantitative comparison of cell type proportions revealed infection-specific shifts relative to the NBH control. Both MV1 and MV2 conditions exhibited a marked increase in excitatory neurons (41.1% in MV1 and 39.4% in MV2 versus 34.5% in NBH) and a corresponding decrease in intermediate progenitor cells (7.0% in MV1 and 5.2% in MV2 versus 13.8% in NBH) and proliferating cells (4.4% in MV1 and 3.4% in MV2 versus 5.9% in NBH). MV2 additionally showed an elevated proportion of inhibitory neurons (13.1% versus 9.9% in NBH). In contrast, astrocyte-like cells and OPCs displayed only modest changes across conditions.
These compositional shifts, evident in both proportional quantification and spatial distribution on UMAP embeddings, as shown in Figure5, suggest that prion infection promotes neuronal differentiation or selective survival of neuronal lineages at the expense of progenitor and proliferative populations. The observed patterns provide a cellular context for interpreting infection-induced transcriptional responses in subsequent analyses.
Infection-Associated Transcriptional Changes
Comparative transcriptomic analyses were performed between MV1, MV2, and NBH conditions across major neural and glial cell populations to characterize infection-associated gene expression changes. Overall, MV1 and MV2 induced distinct and cell type–specific transcriptional programs relative to NBH, suggesting divergent biological responses to infection.
Under the MV1 condition, neuronal populations exhibited pronounced transcriptional activation associated with cytoskeletal remodeling and cellular activation. Both excitatory and inhibitory neurons showed significant upregulation of genes involved in microtubule dynamics and structural plasticity, including MARCKSL1, STMN1, TUBB3, and ACTG1. In contrast, several progenitor and glial populations displayed reduced expression of metabolic and transcription-associated genes. Intermediate progenitor cells and oligodendrocyte precursor cells showed downregulation of neuronal differentiation markers such as DCX, together with decreased expression of mitochondrial and ribosomal genes, indicating a shift away from homeostatic or proliferative states. Astrocyte-like cells similarly exhibited reduced expression of immediate early genes and translational machinery, suggesting attenuated transcriptional activity under MV1 infection.
In contrast, MV2 infection was characterized by a highly consistent and robust upregulation of TTR across nearly all examined cell types, including excitatory neurons, inhibitory neurons, astrocyte-like cells, radial glia, intermediate progenitors, and proliferating cells. This widespread induction of TTR was accompanied by more moderate changes in other genes, with relatively limited activation of cytoskeletal remodeling pathways compared to MV1. In neuronal populations, MV2 was associated with increased expression of stress-response and secretion-related genes such as CRYAB, IGFBP7, and CXCL14, while progenitor and proliferating cells showed enhanced expression of genes related to protein synthesis, metabolic activity, and cytoskeletal stability, including EEF1A1, FTH1, VIM, and multiple ribosomal components.
Notably, oligodendrocyte precursor cells represented an exception to the global MV2 response, exhibiting downregulation of TTR and a broader suppression of transcriptional activity, highlighting cell type–specific sensitivity to infection-associated signals.
Collectively, these results indicate that MV1 infection predominantly induces transcriptional programs associated with neuronal activation, structural remodeling, and altered progenitor differentiation, whereas MV2 infection elicits a distinct response dominated by a TTR-centered, broadly shared transcriptional signature suggestive of enhanced secretory or extracellular signaling processes. These findings, as illustrated in Figure6, underscore the presence of infection-specific and cell type–dependent molecular responses within the neural cellular landscape.
Discussion
The present study systematically evaluated a standardized single-cell RNA-seq analysis workflow through benchmark validation on immune cell data and its application to a human cerebral organoid model of prion infection. The results demonstrate that the adaptive pipeline—combining scVI/scANVI-based batch-aware integration and semi-supervised annotation when batch effects are present, or PCA-based analysis with CellTypist/marker validation when they are absent—reliably recovers biologically coherent cell populations and detects infection-associated transcriptional changes.
Validation on the immune cell dataset confirmed the robustness of both branches of the workflow. The moderate similarity between PCA- and scVI-based clustering (ARI ≈ 0.60), together with high concordance in major cell type annotations across the two pipelines, indicates that the framework is flexible and effective across different representation learning strategies (Figure3 and Figure4). This adaptability is particularly valuable for real-world datasets, where technical variability may vary in severity.
Application to the human cerebral organoid prion infection dataset (GSE309815) revealed clear cell type–specific responses to MV1 and MV2 infection at approximately 120 days post-infection. Unsupervised clustering and marker-based annotation identified seven major populations with distinct spatial separation in UMAP embeddings (Figure~\ref{fig:celltype}). Quantitative compositional analysis showed that both MV1 and MV2 conditions were characterized by a marked expansion of excitatory neurons (41.1% and 39.4%, respectively, versus 34.5% in NBH) and a corresponding reduction in intermediate progenitor cells (7.0% and 5.2% versus 13.8%) and proliferating cells (4.4% and 3.4% versus 5.9%). MV2 additionally exhibited an increased proportion of inhibitory neurons (13.1% versus 9.9% in NBH). These shifts suggest that prion infection may promote neuronal differentiation or confer selective survival advantages to post-mitotic neuronal lineages at the expense of progenitor maintenance and proliferation.
Differential expression analysis further highlighted divergent transcriptional programs between MV1 and MV2 (Figure6). MV1 infection predominantly activated genes associated with cytoskeletal remodeling and structural plasticity in neuronal populations, including MARCKSL1, STMN1, TUBB3, and ACTG1. These changes are consistent with prion-induced neuronal injury, synaptic dysfunction, and compensatory remodeling of the actin-microtubule cytoskeleton. In contrast, MV2 elicited a remarkably consistent and widespread upregulation of TTR (transthyretin) across nearly all cell types, accompanied by more moderate induction of stress-response and secretion-related genes such as CRYAB, IGFBP7, and CXCL14. Notably, oligodendrocyte precursor cells (OPCs) were an exception, showing downregulation of TTR and broader transcriptional suppression, suggesting cell type–specific resistance or vulnerability to MV2 signals.
The pronounced and near-ubiquitous induction of TTR under MV2 is particularly intriguing. Transthyretin is best known as a transporter of thyroxine and retinol in plasma and cerebrospinal fluid, but it also exhibits chaperone-like activity and neuroprotective effects in the central nervous system. Its dramatic upregulation across diverse cell types may represent a conserved protective response to MV2 infection, potentially mitigating protein misfolding or extracellular stress. The limited activation of classical unfolded protein response (UPR) genes (ATF4, DDIT3, HSPA5) in our dataset suggests that the infection time point (120 dpi) may precede peak UPR activation or that MV1 and MV2 trigger partially distinct stress pathways.
Several limitations should be noted. First, the analysis was restricted to the 120 dpi time point; later stages (e.g., 180 dpi) may reveal more pronounced UPR activation or progressive neuronal loss. Second, although the workflow effectively mitigated batch effects, residual technical variation or low infection efficiency could have masked subtle infection signatures. Third, cell type annotation relied on marker genes and automated prediction without a direct reference atlas matched to human cerebral organoids, which may introduce minor misclassification in transitional or immature states.
Despite these limitations, the present results provide a solid foundation for understanding prion infection in human neural tissue models. The distinct transcriptional responses of MV1 (neuronal remodeling) and MV2 (TTR-dominated response) highlight the value of molecular strain-specific studies in prion disease. Future work should extend the analysis to later time points, incorporate multi-omic data (e.g., ATAC-seq or spatial transcriptomics), and validate candidate genes such as TTR and MARCKSL1 using functional assays in organoid models. These efforts will further elucidate the cellular mechanisms underlying prion strain diversity and inform potential therapeutic strategies targeting cell type–specific pathways.
In summary, this winter research training not only consolidated practical skills in single-cell RNA-seq analysis but also generated biologically meaningful insights into infection-associated changes in human cerebral organoids, demonstrating the power of standardized workflows in exploring complex disease models.
HEUMOS L, SCHAAR A C, LANCE C, et al. Best practices for single-cell analysis across modalities[J/OL]. Nature Reviews Genetics, 2023, 24(8): 550-572. https://oi.org/10.1038/s41576-023-00586-w. DOI: 10.1038/s41576-023-00586-w. ↩︎
LUECKENMD, BURKHARDT D B, CANNOODT R, et al. A sandbox for prediction and integration of DNA, RNA, and proteins in single cells[COL]//Thirty-fifth Conference on Neural Information Processing Systems Datasets and Benchmarks Track (Round 2). 2021. https://openreview.net/forum?id=gN35BGa1Rt. ↩︎
Single-cell RNA-seq of human cerebral organoids under infection conditions[EB/OL]. 2024. https://www.ncbi.nlm.nih.gov/geo/query/acc.cgi?acc=GSE309815. ↩︎